INTRODUCTION
The maps in this site were created using ArcGIS (Geographic Information System) software from Esri (Environmental Systems Research Institute Inc.- esri.com) provided to the University of Toronto through an educational site license from Esri Canada (esri.ca.) Designing and serving these as web maps was done using a variety of Open Source software solutions: Openlayers, Openlayers for Drupal, PostGIS, Tilemill from Mapbox, with additional base mapping provided by Openstreetmap.
SOURCES
Base mapping was originally adapted from the Digital Chart of the World dataset, which has a nominal scale of 1:1,000,000, using historical maps and other sources for the reconstruction of boundaries and routes as they likely existed prior to 1642. See the sections relating to the maps in the Sources of Evidence and Bibliography pages for further details. The original mapping has been re-drawn for larger scale web mapping using Ordnance Survey Openmap online base mapping resources, especially OS Vectormap District and Local. Additional details of place locations, county boundaries, and rivers and roads came primarily from historical Ordnance Survey of Great Britain maps, as well as online resources such as Pastscape.org, Gatehouse-gazetteer.info, British History Online, British Listed Buildings Online, NationalTrust.org.uk, Wikipedia.org, and many municipal and local history websites.
MAP VIEWING CONTROLS
 The general map viewing controls will be familiar to most users. In the top left corner are the ‘Zoom’ controls. In the top right corner is a button to make the map "Fullscreen"; clicking the icon just below that will allow the user to turn map layers on or off. In the bottom right, clicking on ‘Legend’ will pop up a graphic explanation of map symbols. There is some variation in how the map controls appear in different contexts on the site, but these main functions are generally available.
The display of various map details are dependent on the scale at which the map is being viewed. This approach is familiar to most users: if all the detail contained on the map was shown when viewing the entire country, the map would be far too crowded to read. Therefore, some map layers only become visible as the user zooms in on the map. The display of names of places and counties is also dependent on the viewing scale: not all will appear at every scale, so in certain instances the user may have to zoom in to resolve place identification. Users may also use Openstreetmap as an alternative base map for viewing locations in relation to present-day geography.
LEGEND DETAILS
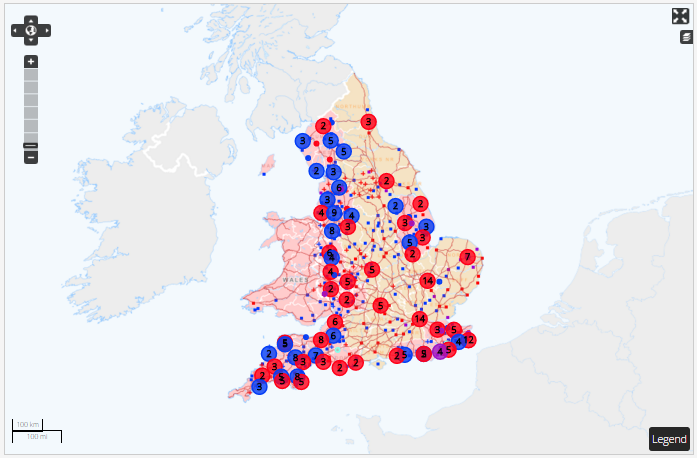
Venues are places identified through REED research as locations where performances occurred or may have occurred. They appear as selected performance venues as the result of a search and selection of the REED database. Other searches will result in REED ‘Events’ being selected - these are shown on the map as yellow circles. When selected features are clustered together geographically, they are shown as larger circles with the number of selected features inside the symbol. Clicking on these selected symbols pops up lists and links for the selected features.
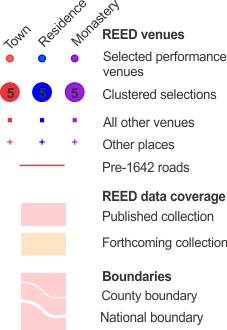
Solid red lines indicate mid-17th century routes for which there exists detailed cartographic evidence. Routes that must be considered speculative are shown as dashed lines. See the sections on roads in Sources of Evidence and Bibliography.
REED data coverage colours indicate counties for which REED data has been published and is online. For more information see the Present Data Coverage page. Pre-1642 county boundaries are shown. Rivers, lakes and shorelines are based on modern source maps. These have not been adapted to the pre-1642 period, and should therefore be used for general visual reference only. At the map's fullest extent only major rivers appear; detailed rivers and lakes will appear as the user zooms in.